
What an excellent infographic!
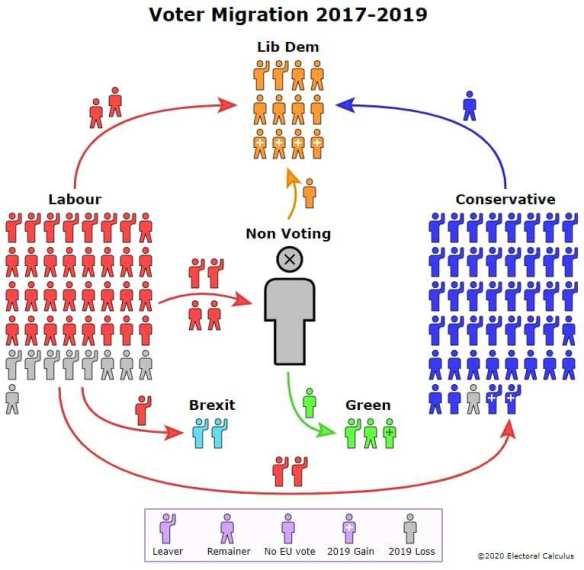
This graphic says a lot, but you have to know a bit to realise that losing 9 out of 41 voters, like Labour did, – or a 4.5% swing away – is towards an upper limit of what happens between General Elections.
It also doesn’t show explicitly enough what the non-voting number actually is; and completely misses how many people are not registered.
But perhaps Labour members are already forgetting.
